This is the 10th installment of the "Getting Started" series. I asked Sanjay if I could add some posts that describe the more statistical statements. Computing and displaying linear and nonlinear fit functions is one of my favorite statistical topics, so I will start with the REG statement.
The REG statement fits linear regression models, displays the fit functions, and optionally displays the data values. You can fit a line or a polynomial curve. You can fit a single function, or when you have a group or classification variable, fit multiple functions. (PROC SGPLOT provides a GROUP= option and statistical procedures such as PROC GLM provide a CLASS statement that you can use to specify groups.)
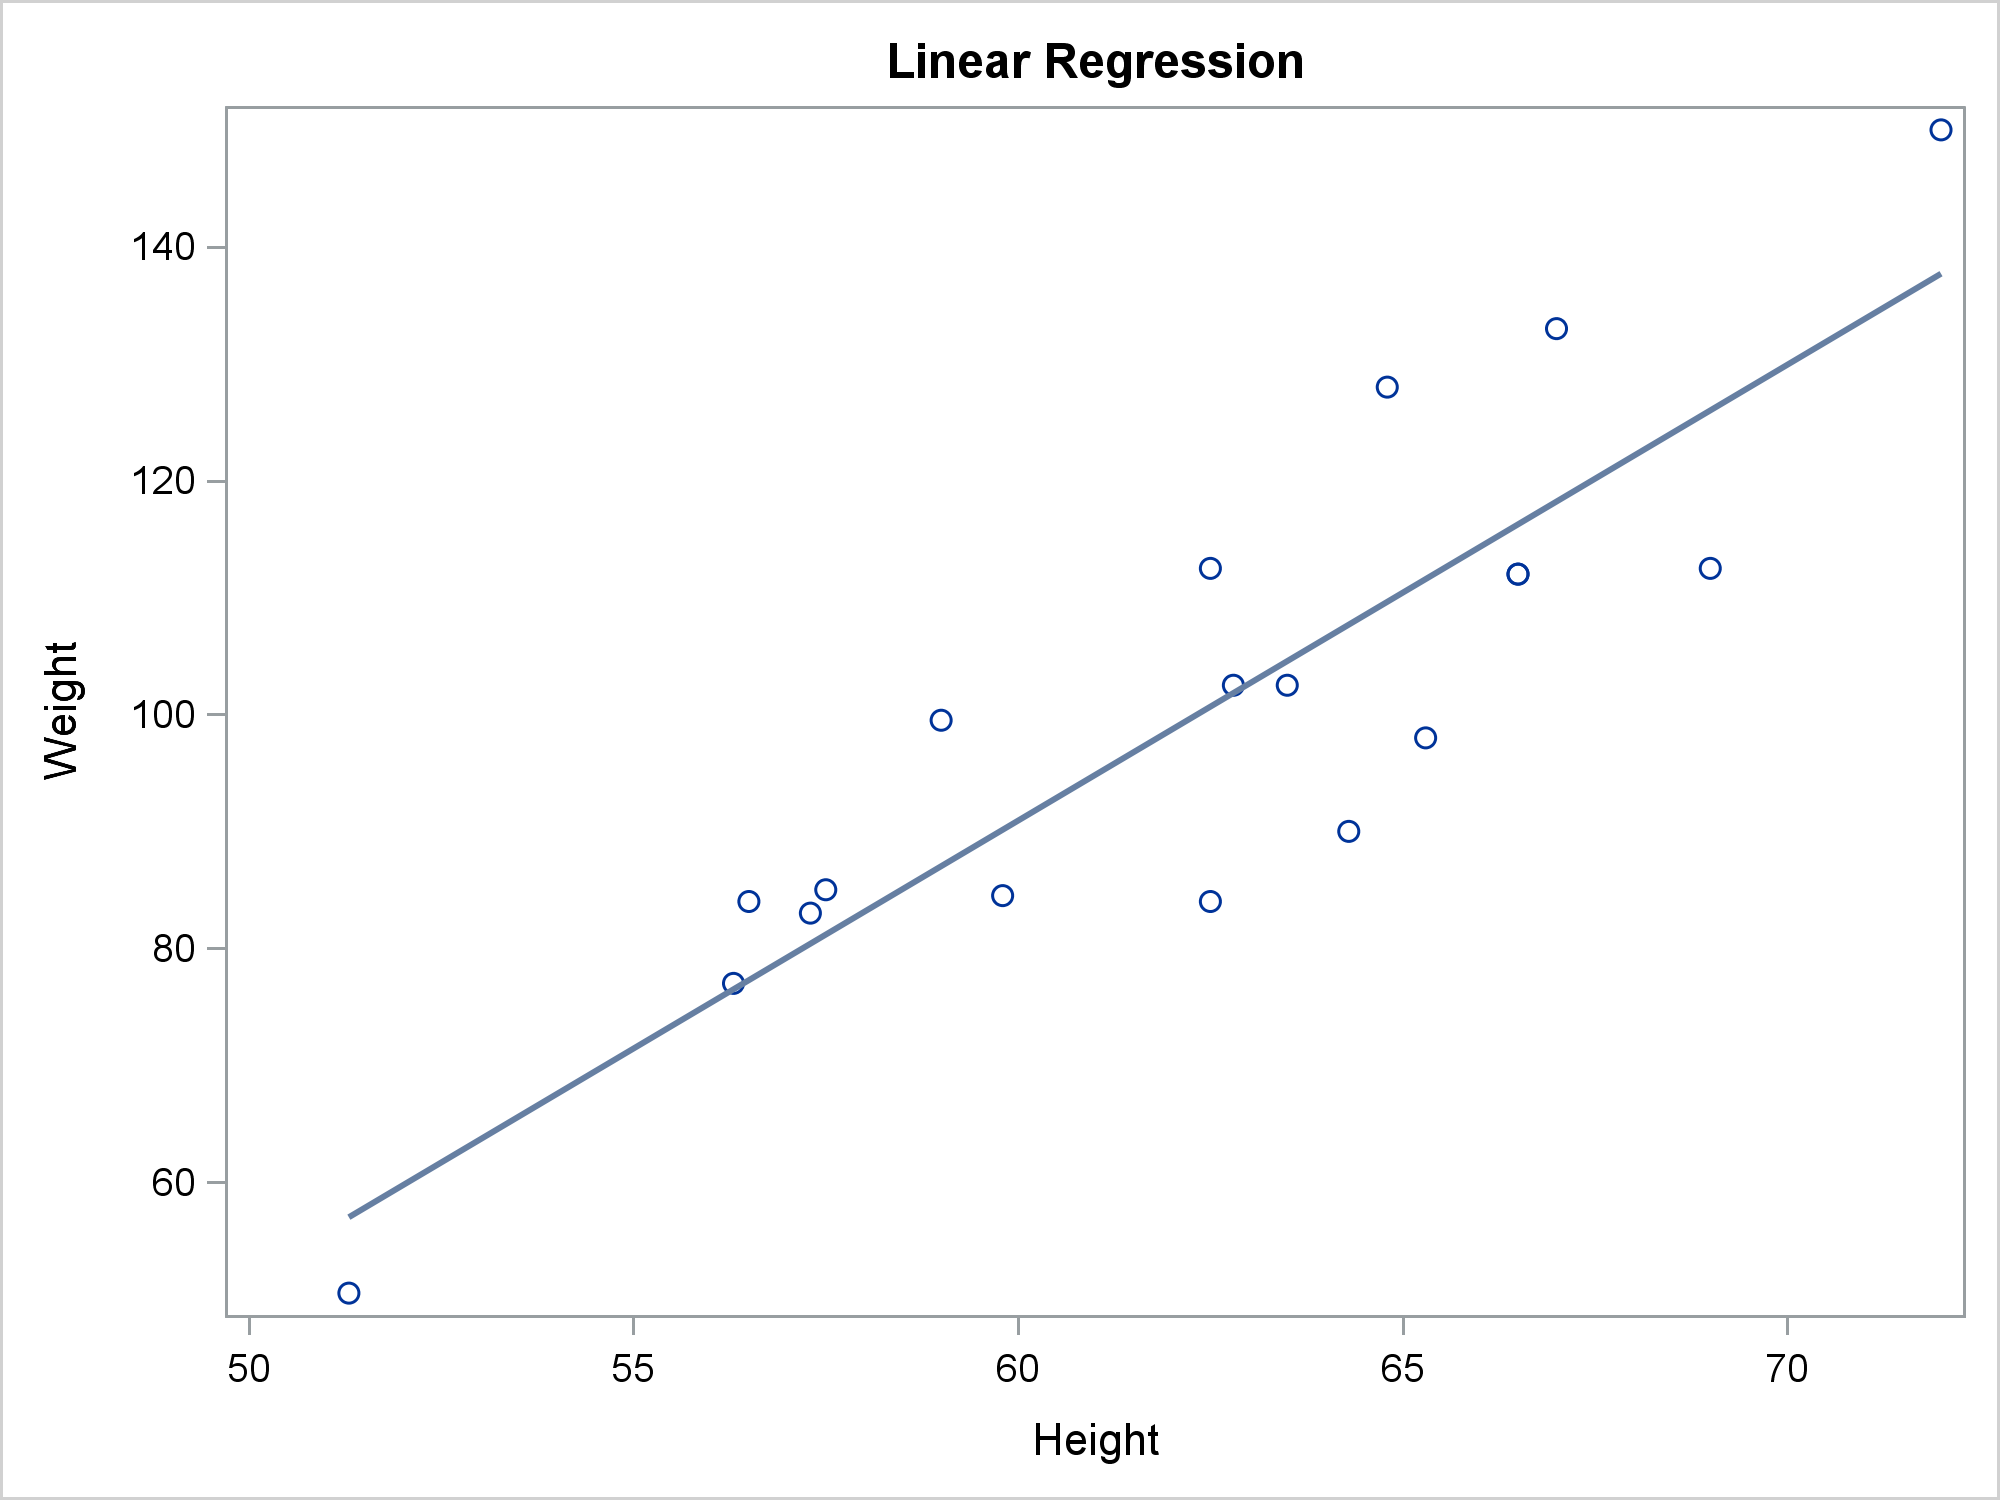
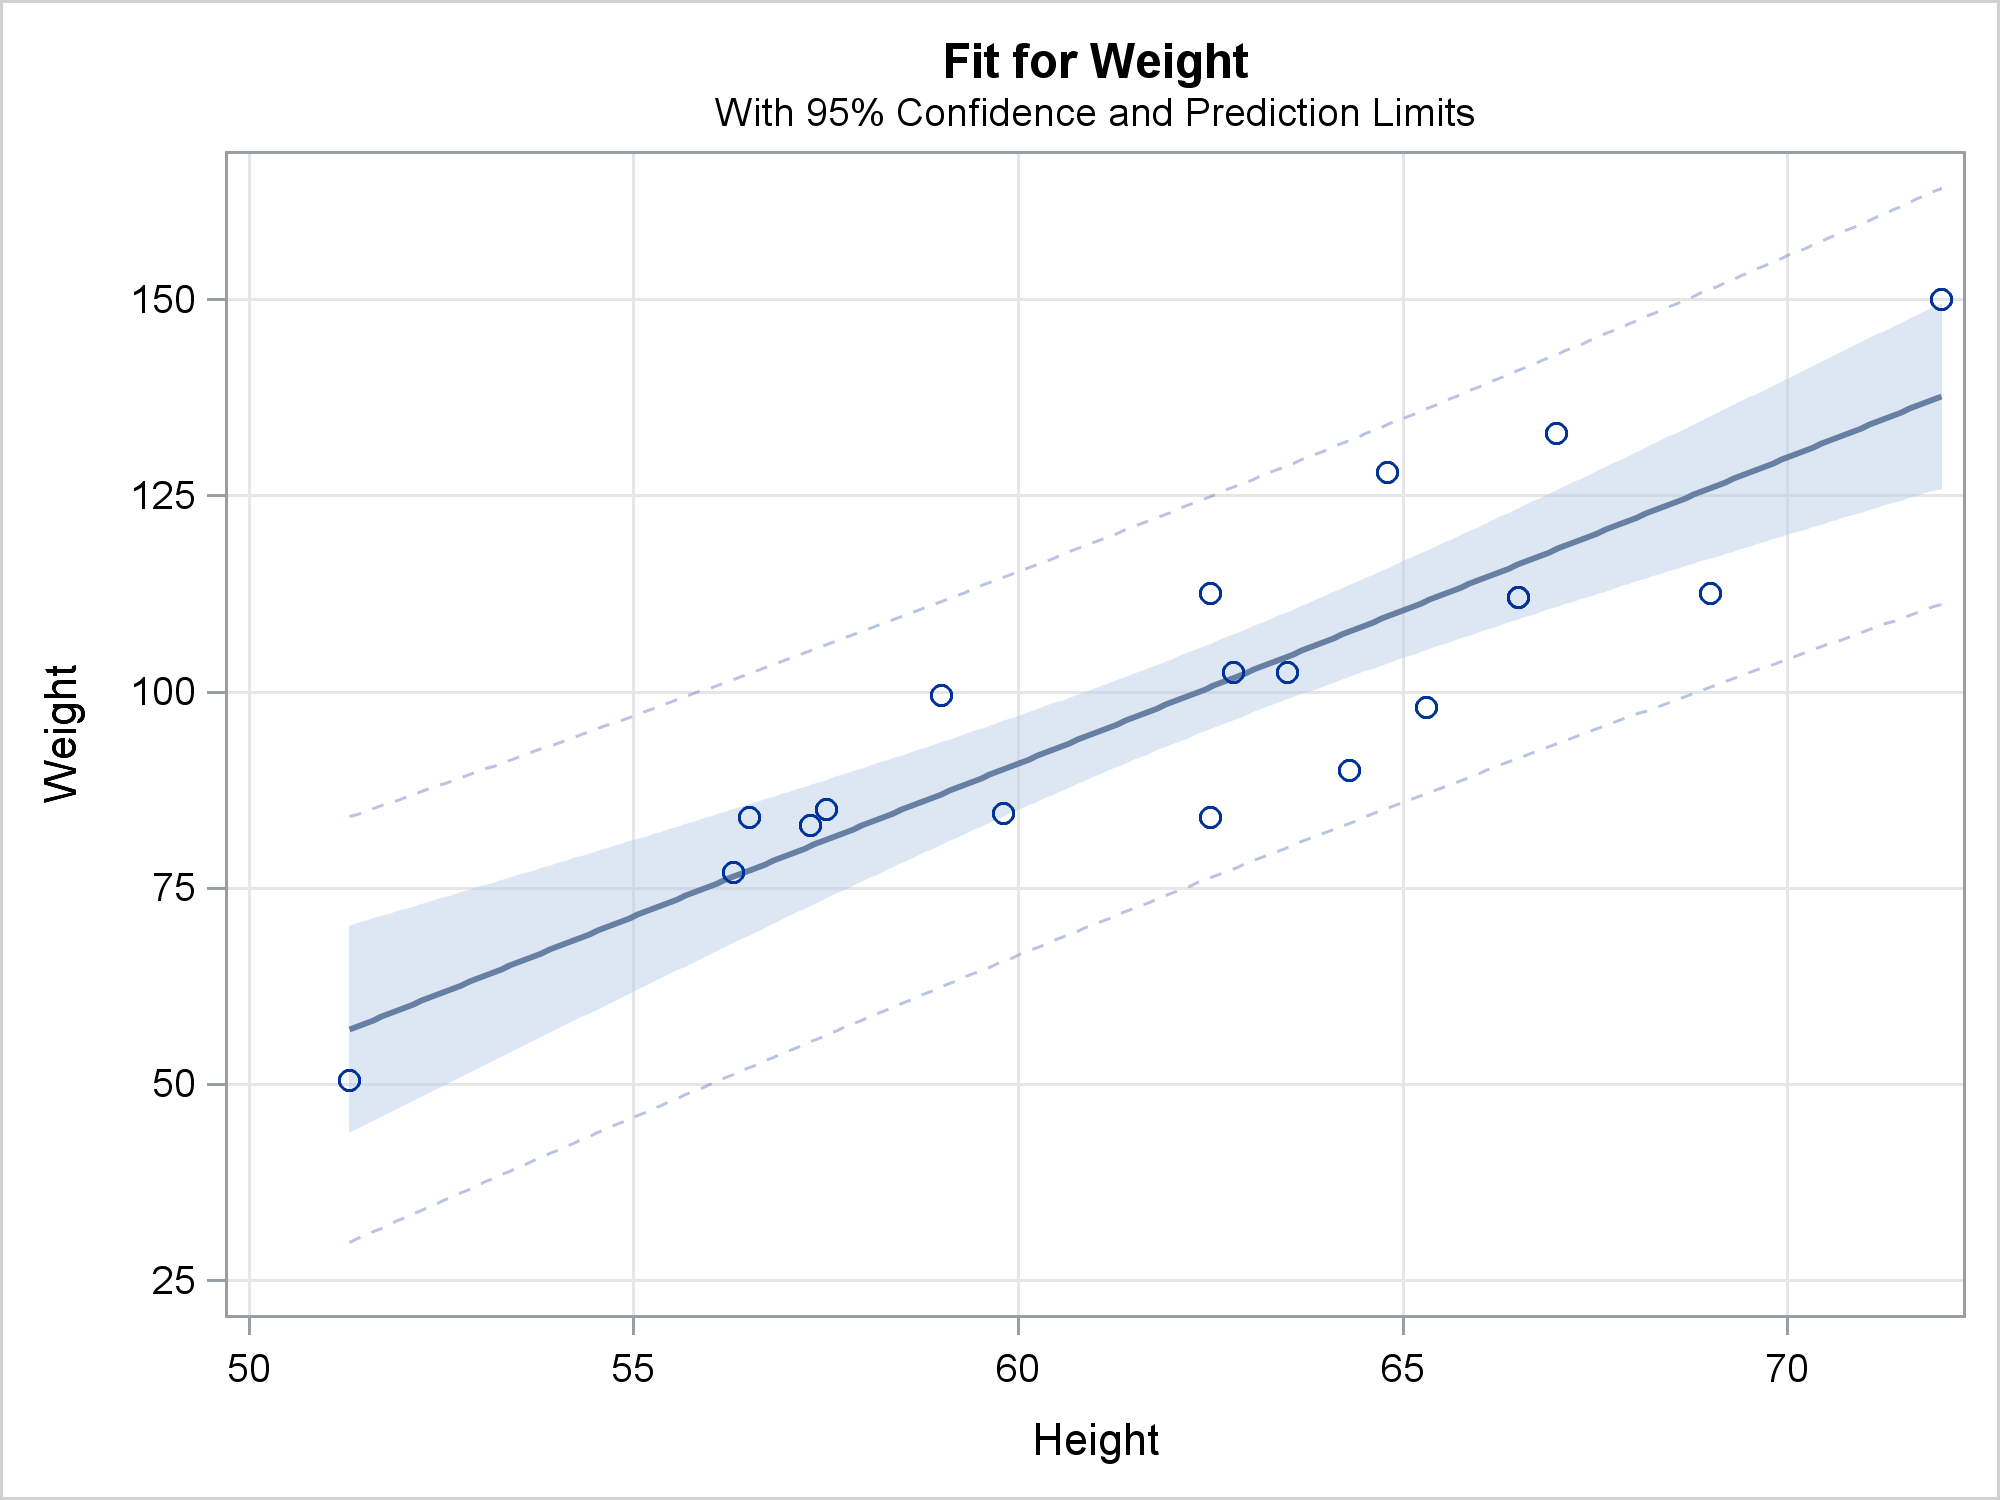
The following step displays a single line and a scatter plot of points.
proc sgplot data=sashelp.class noautolegend; title 'Linear Regression'; reg y=weight x=height; run; |
You can suppress markers by specifying the NOMARKERS option in the REG statement. Then you can use the SCATTER statement to display nondefault markers. This example uses the GROUP= and MARKERCHAR= options in the SCATTER statement to differentiate the males and females. (If I were doing anything more complicated than displaying single-character markers, I would instead use the TEXT statement.) The fit function and the underlying model have not changed.
proc sgplot data=sashelp.class noautolegend; title 'Linear Regression with Markers Displayed by a SCATTER Statement'; scatter y=weight x=height / group=sex markerchar=sex; reg y=weight x=height / nomarkers; run; |

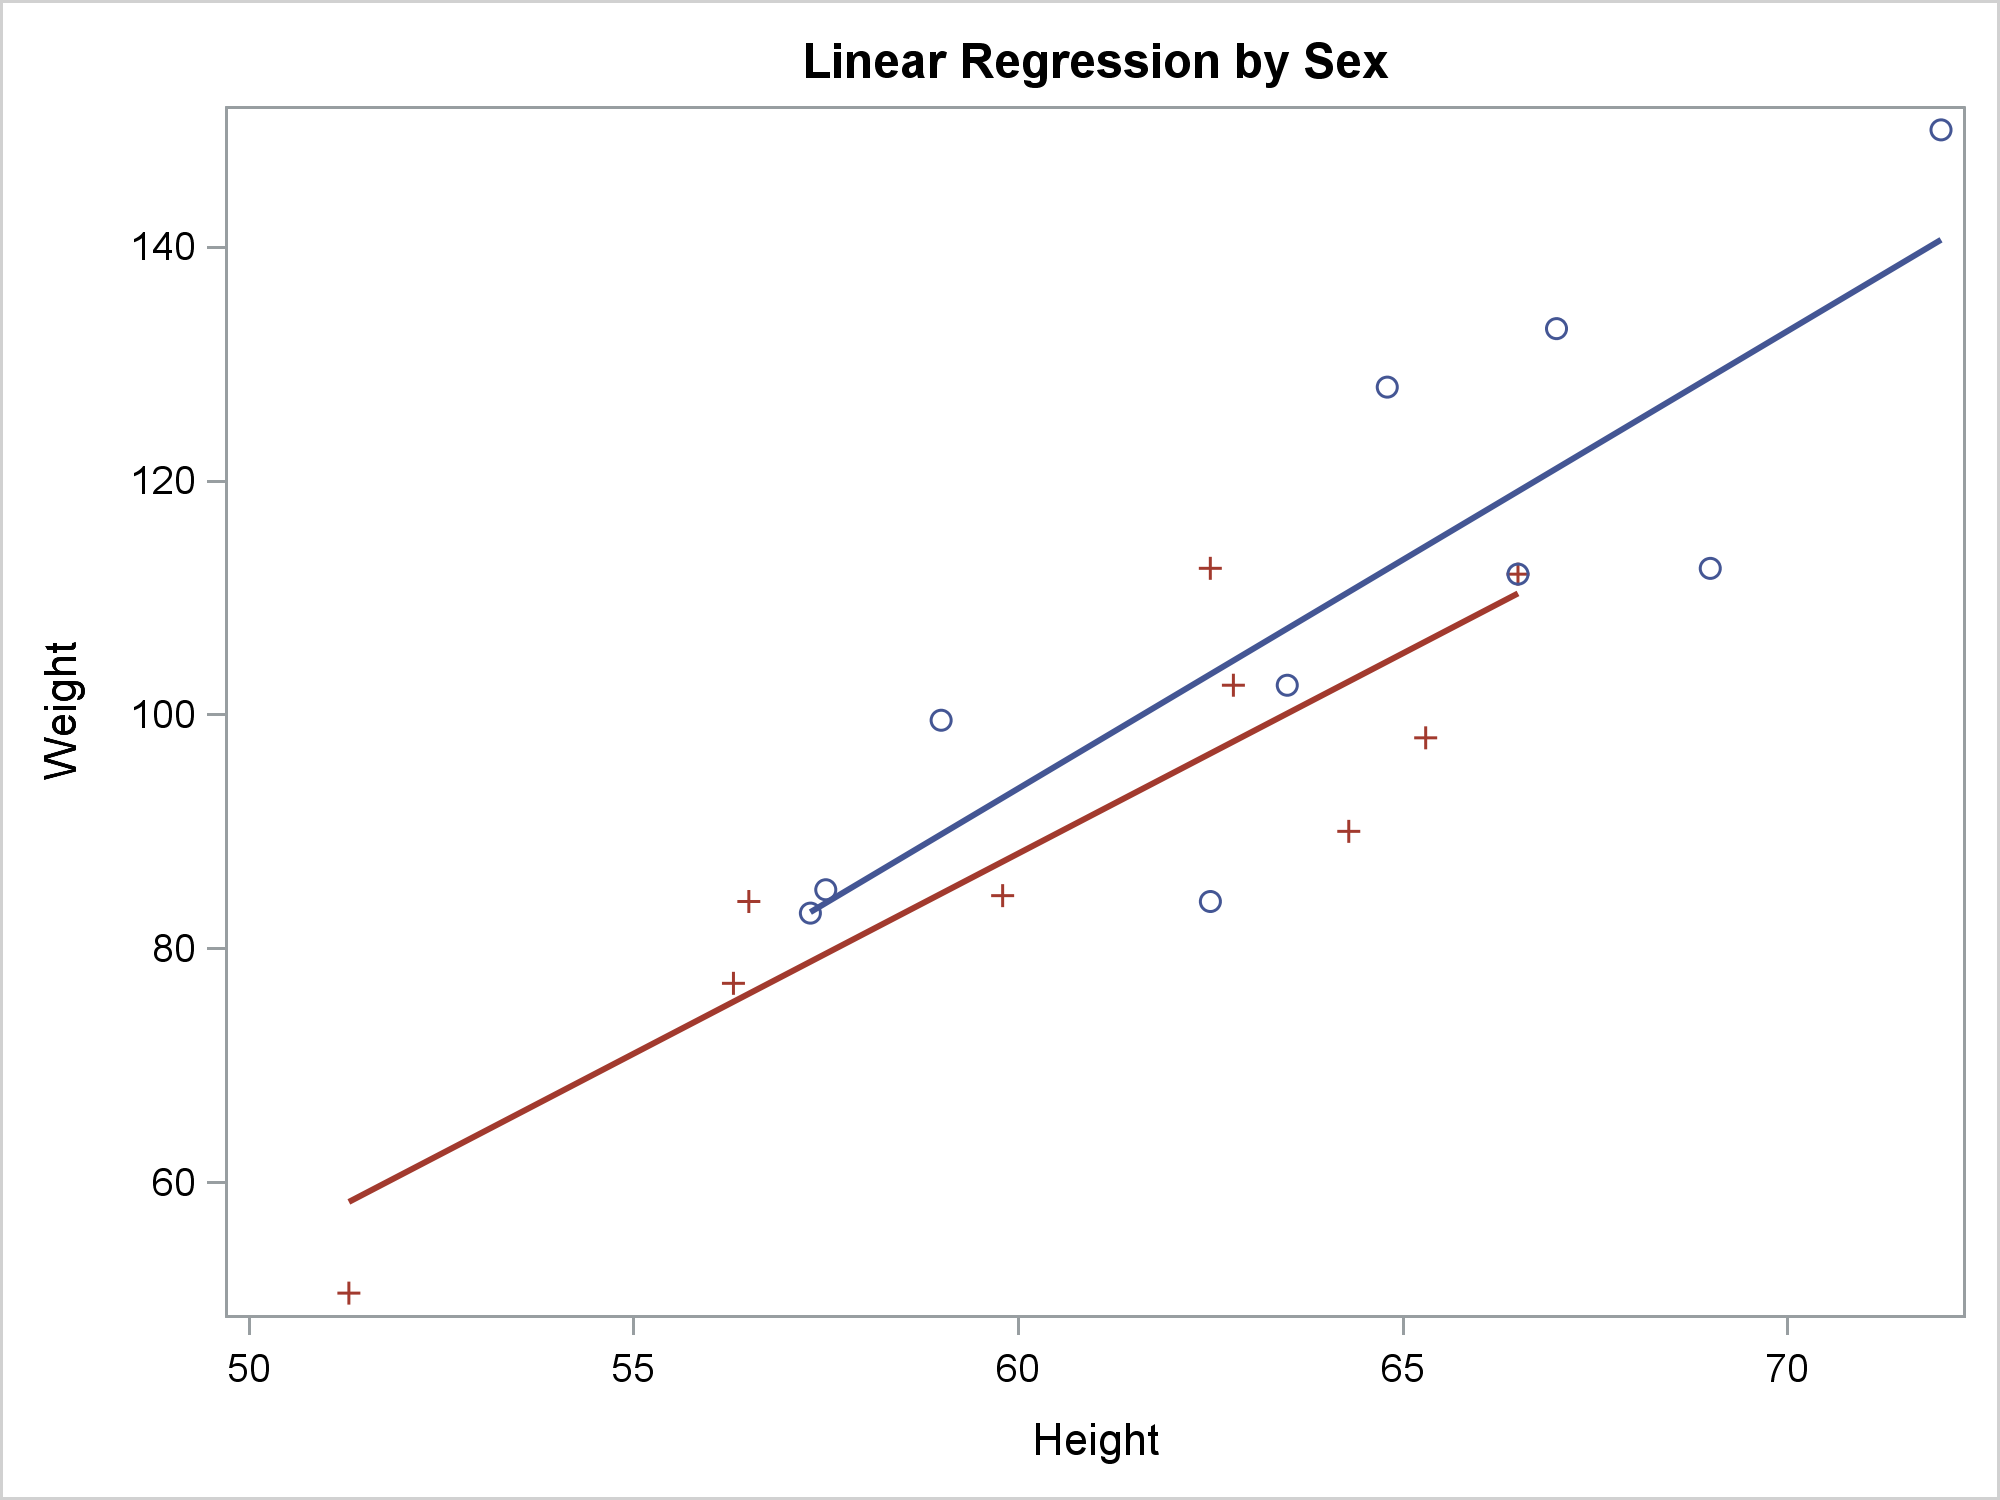
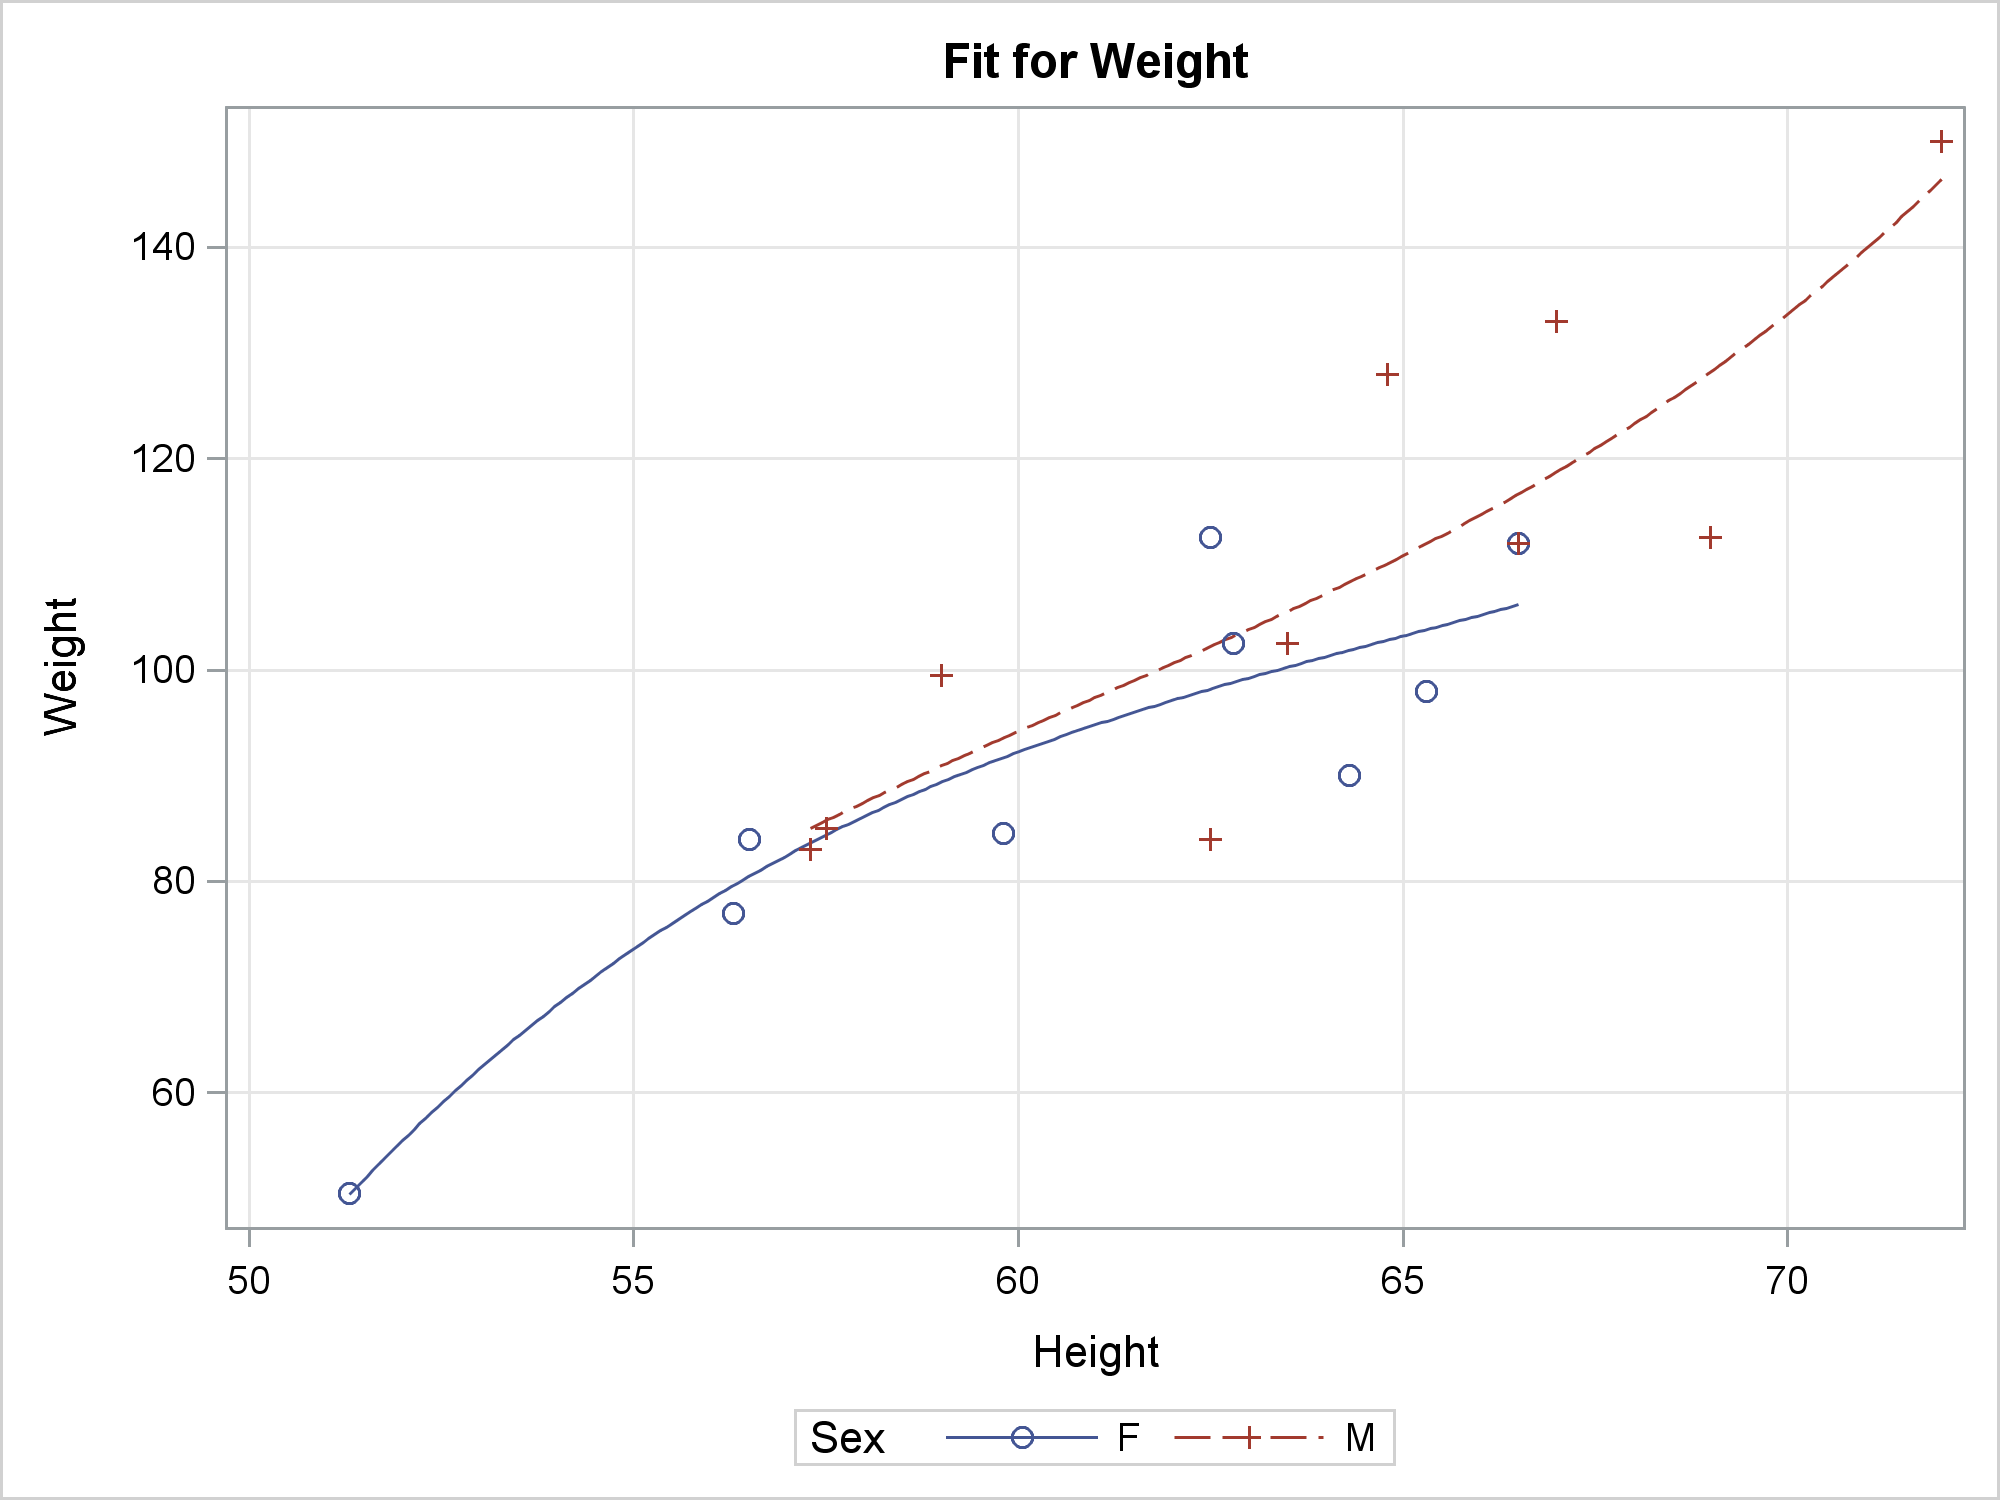
You can specify the GROUP= option in the REG statement to get a separate fit function for each group. You can also specify ATTRPRIORITY=NONE in the ODS GRAPHICS statement and a STYLEATTRS statement to vary the markers for each group while using solid lines.
ods graphics on / attrpriority=none; proc sgplot data=sashelp.class noautolegend; title 'Linear Regression by Sex'; styleattrs datalinepatterns=(solid); reg y=weight x=height / group=sex; run; |
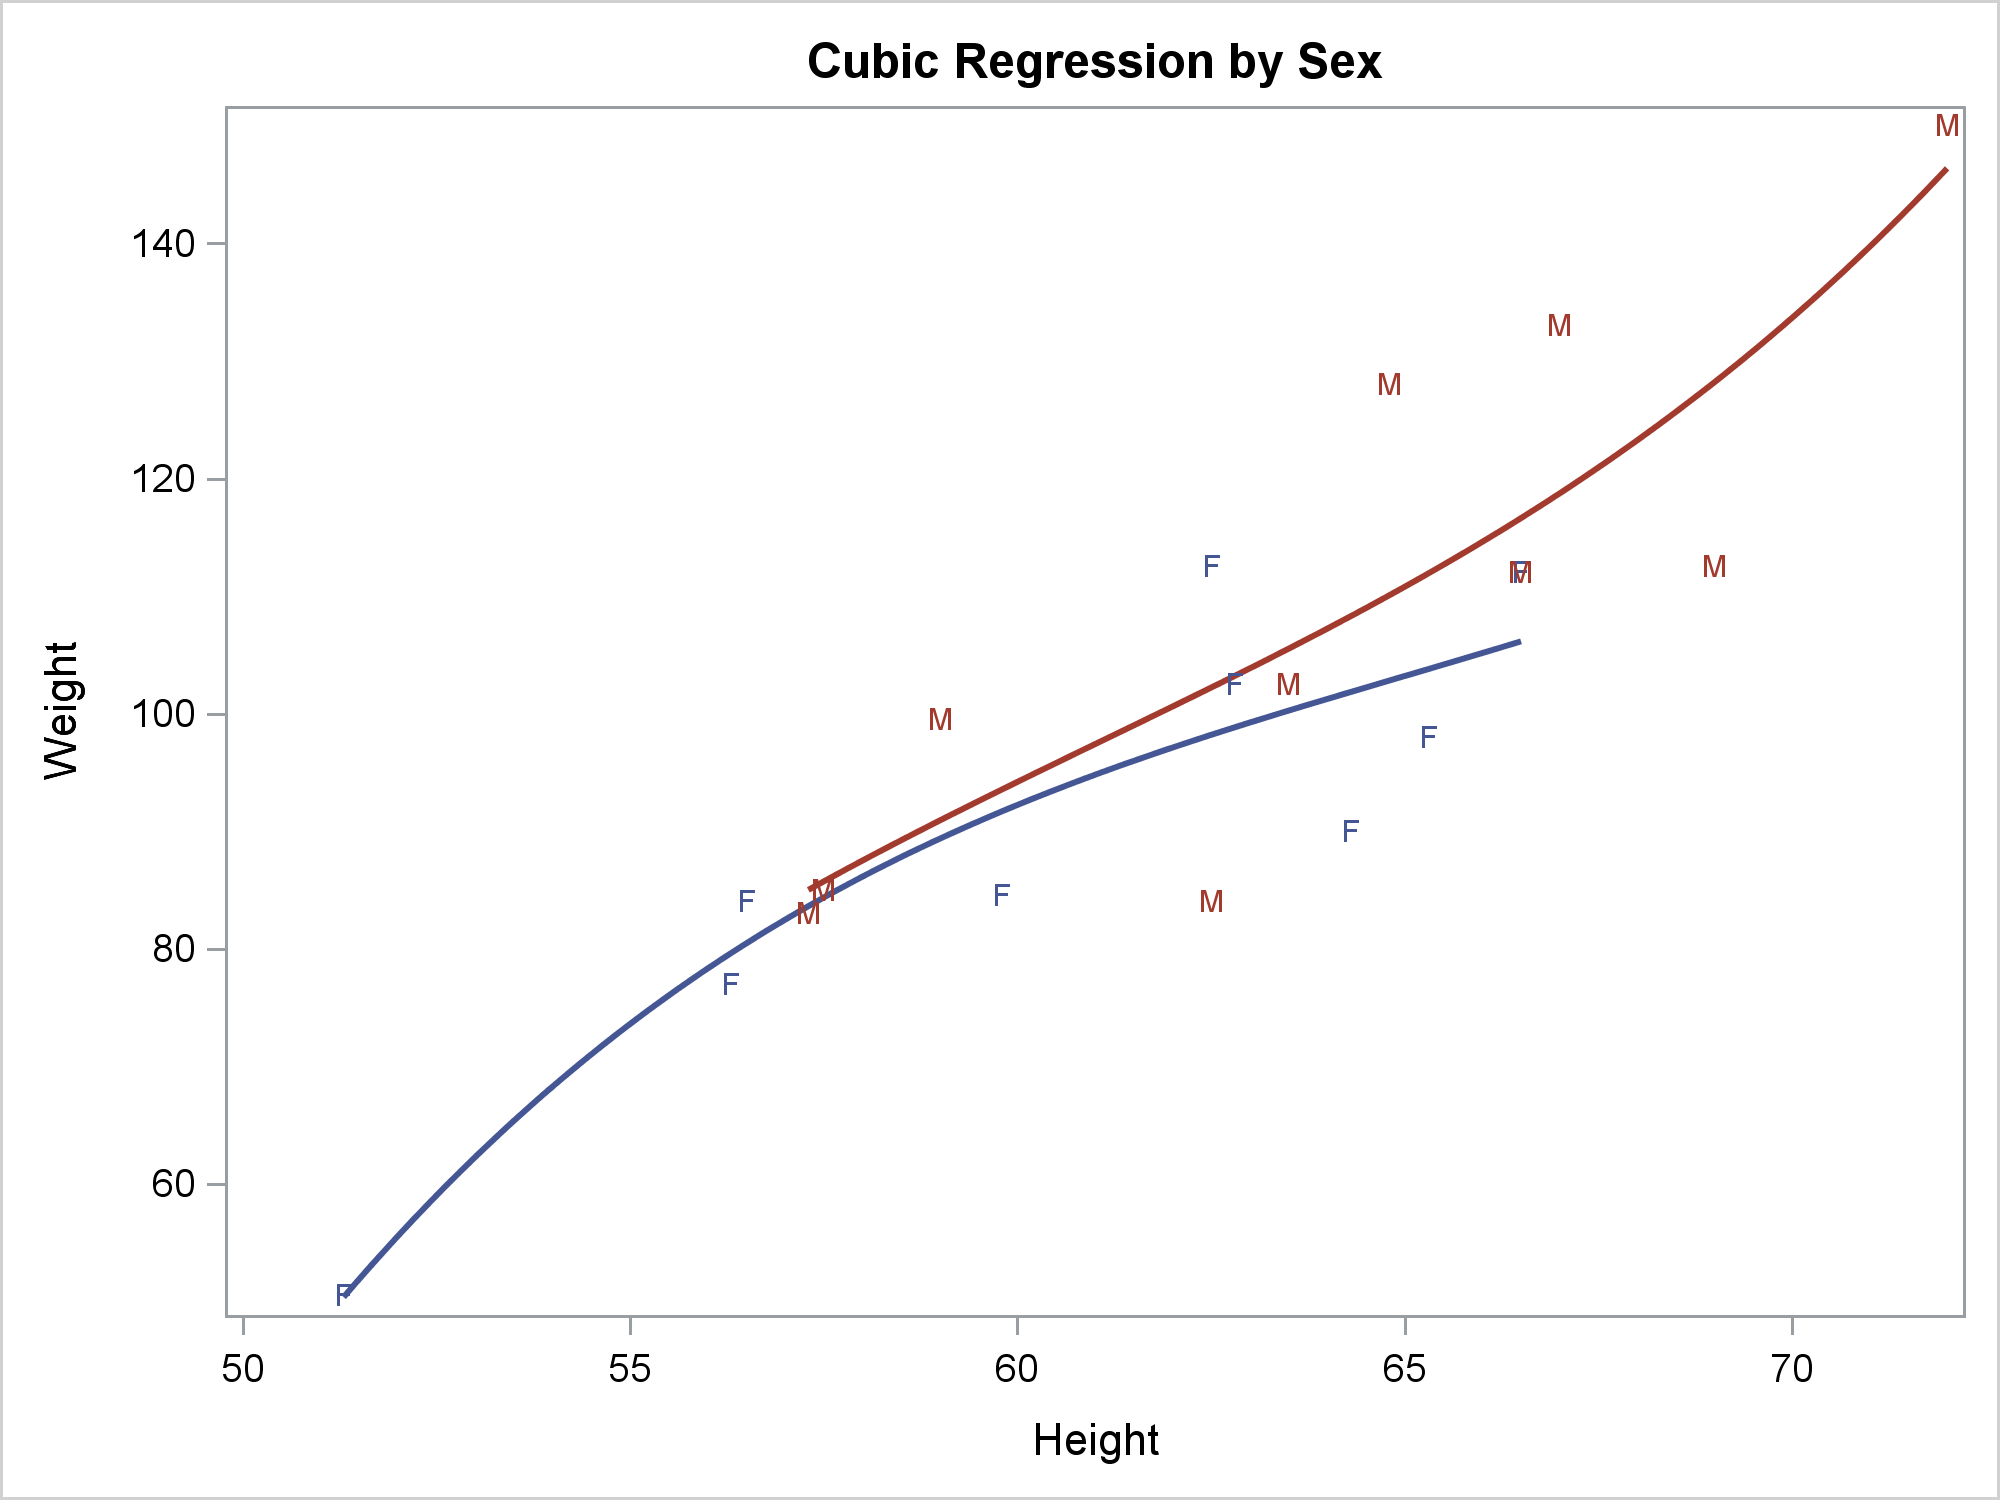
The next step uses a SCATTER statement to display nondefault markers. Notice that the color assignment changes. Previous plots display the males in blue and the females in red. In previous plots, the first observation, Alfred, is male, so males are displayed using the GraphData1 style element, which has blue colors. Females are displayed using the GraphData2 style element, which has red colors. This step has an ODS OUTPUT statement. If you display the output data set, you will see that the females are displayed first using GraphData1 and the males are displayed second using GraphData2. This step also specifies the DEGREE=3 option, which finds cubic polynomial fit functions. You could instead specify DEGREE=2 for quadratic fit functions. Usually, if you want to enable the function to be less smooth than a cubic polynomial, you should use the PBSPLINE or LOESS statements rather than specifying DEGREE=4 or a higher degree.
proc sgplot data=sashelp.class noautolegend; title 'Cubic Regression by Sex'; styleattrs datalinepatterns=(solid); reg y=weight x=height / nomarkers group=sex degree=3; scatter y=weight x=height / group=sex markerchar=sex; ods output sgplot=sg; run; |
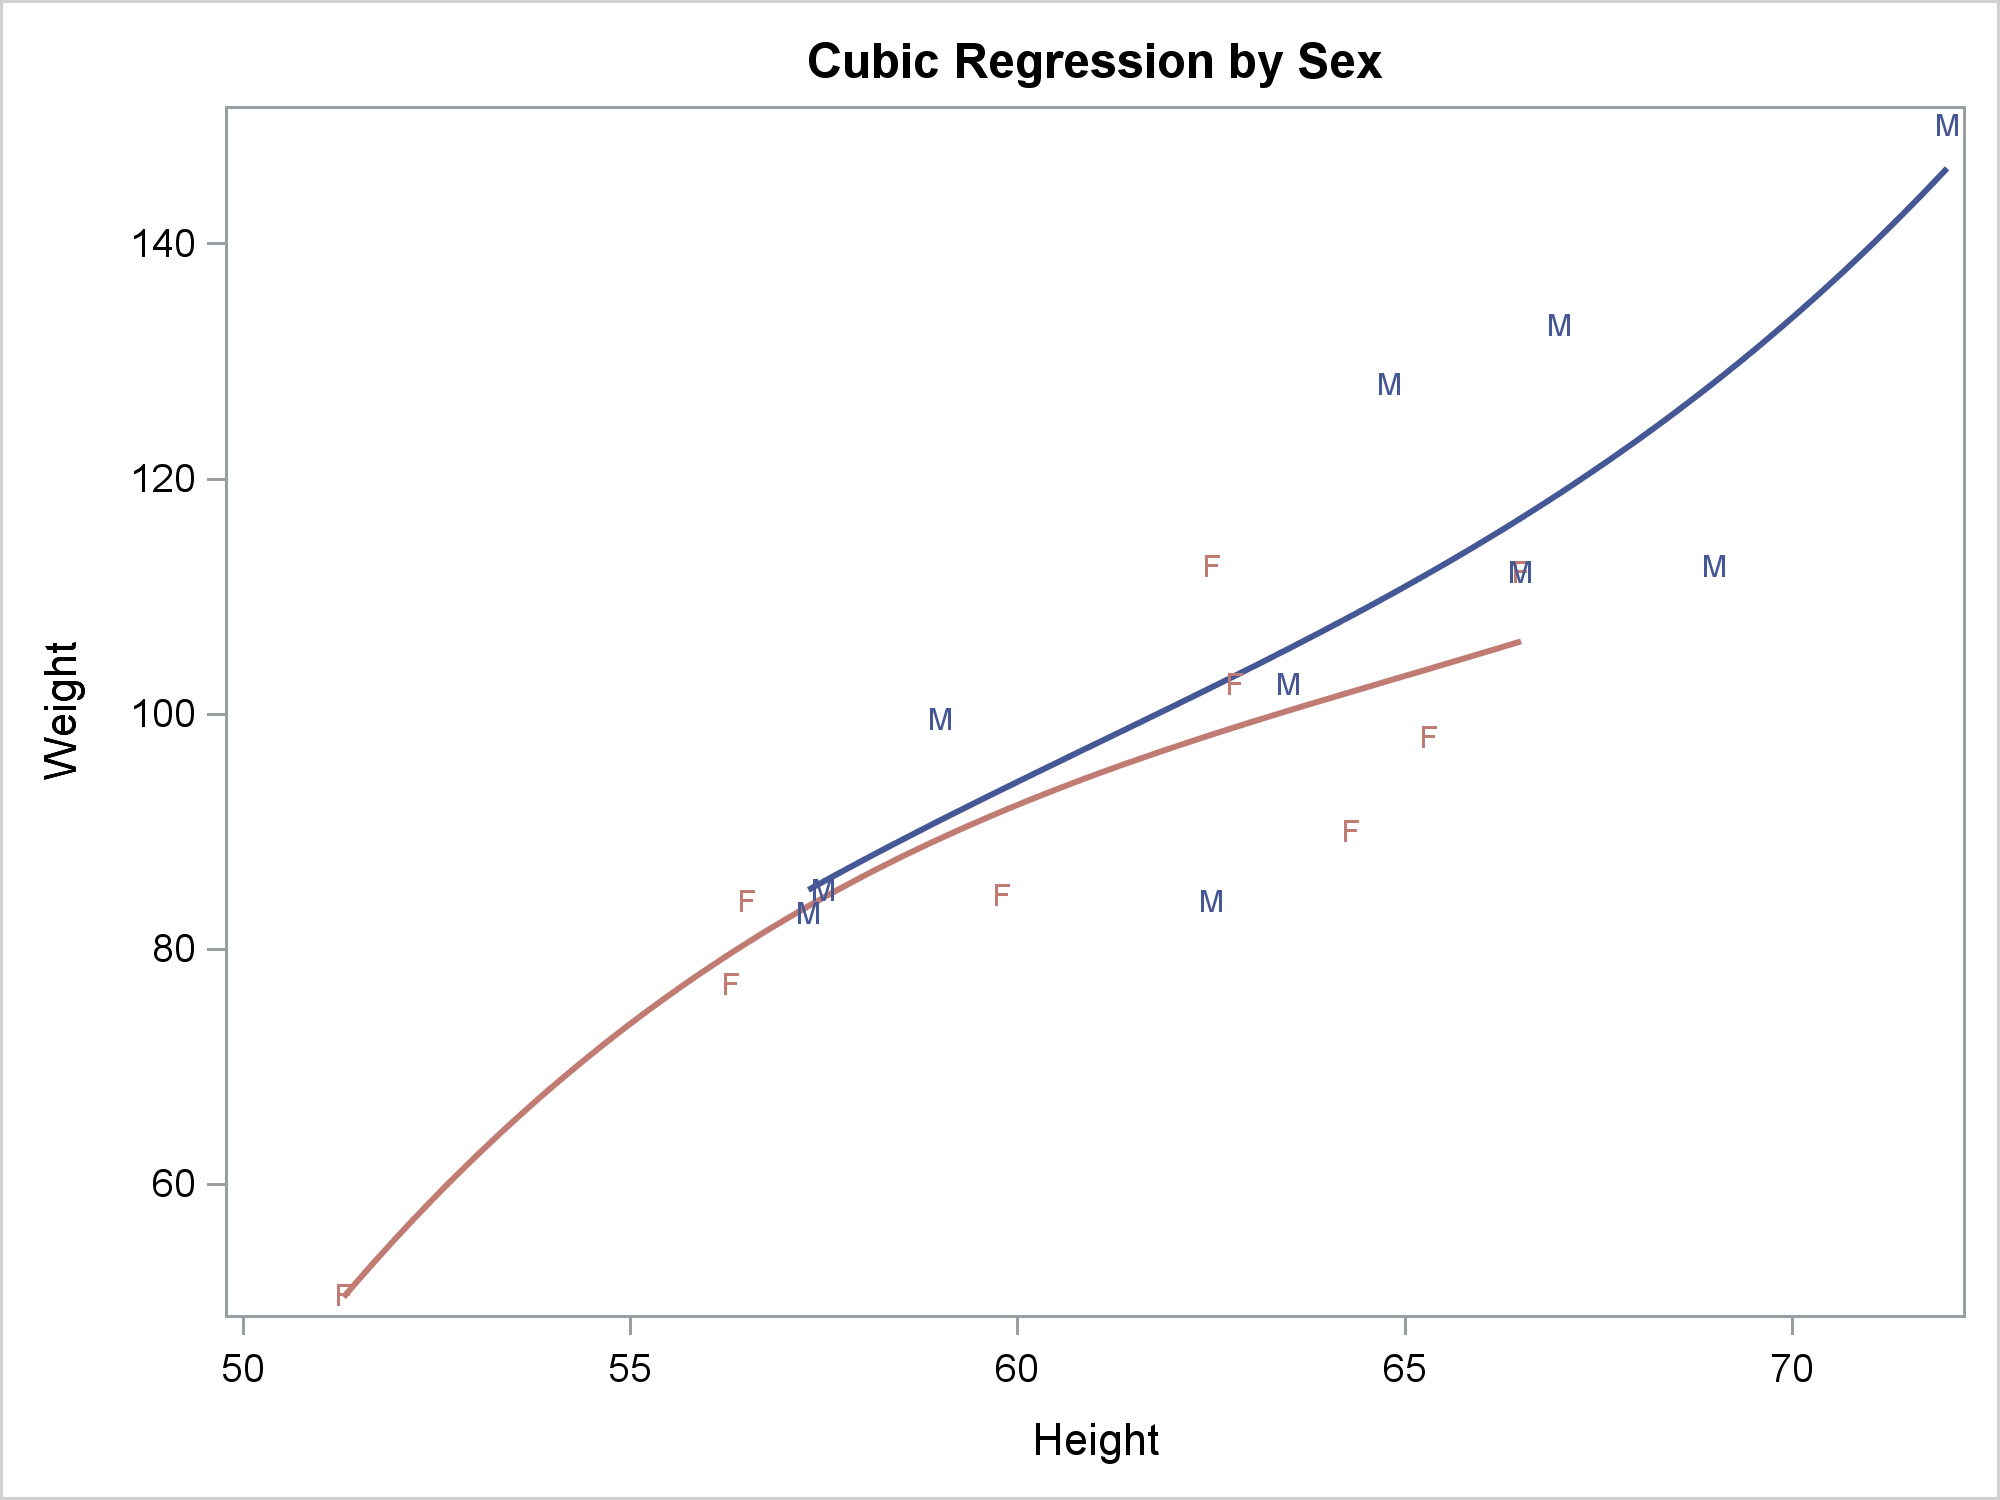
This next step changes the colors back by specifying them in the DATACONTRASTCOLORS= option in the STYLEATTRS statement. I determined the color names by using a utility program that shows the colors of points on the screen. You could instead look at the style or simply specify the colors that you want. Note that the discrete attribute map provides a more general method of controlling how groups are displayed.
proc sgplot data=sashelp.class noautolegend; title 'Cubic Regression by Sex'; styleattrs datalinepatterns=(solid) datacontrastcolors=(CXC07B73 CX455794); reg y=weight x=height / nomarkers group=sex degree=3; scatter y=weight x=height / group=sex markerchar=sex; run; |
There are many SAS procedures that can fit linear and cubic regression models. They include the GLM, REG, ORTHOREG, and TRANSREG procedures. Both ORTHOREG and TRANSREG support CLASS variables and polynomials quite easily. I will illustrate fitting the same models in PROC ORTHOREG.
This step fits a linear regression model.
proc orthoreg data=sashelp.class; model weight = height; effectplot fit / obs; run; |
This step fits a separate cubic regression model for each level of the CLASS variable.
proc orthoreg data=sashelp.class; class sex; effect poly = polynomial(height / degree=3); model weight = poly | sex; effectplot slicefit / obs; run; |
Statistical procedures give you more control over the statistical models and create specialized statistical output. The REG statement in PROC SGPLOT gives you an easier way to control the graph. For more options, see the documentation for the REG statement, PROC ORTHOREG, or one of the other modeling procedures.


5 Comments
Never knew about the MARKERCHAR= option in the SCATTER Statement. Neat!
Thank you Warren. Very nice article.
Thanks, Peter! Also note that the TEXT statement provides a great deal of flexibility in adding text to graphs.
Pingback: Getting started with SGPLOT - Index - Graphically Speaking
Why is it not possible to display the fit parameters in the plot? I know one could run PROC REG beforehand, but that would mean running the same linear fit twice! What a waste of CPU time!
The best thing to do would be to put a request into Technical Support. This helps us track the features people need. Thanks!